This help page of ConTra provides a step-by-step walk through of the analysis process.
|
|
This help page of ConTra provides a step-by-step walk through of the analysis process. |
| Step 1: Select the type of analysis and specify the genes |
|
ConTra consists of 2 parts, each giving a suggestive answer to a different type of question: |
|
To start a ConTra analysis the user can provide different kinds of information about the gene(s) or transcript(s) he wants to analyse: Position tags (format !-2378<->-1500!) indicate the positions, relative to the transcription start site (TSS) of the reference species transcript(s), of the following alignment piece. If no position tags are used, the last base of the reference species sequence will be considered to be the position -1. If a blastz-net pairwise alignment contains several alignment pieces that need to be analyzed/visualized as one, then the different pieces can be concatenated with position tags as is shown above. This concatenation is mainly important for the exploration part. As for the visualization part, only in the files for Jalview the pieces can be taken together, not in the html view. One can also upload an own collection of PWMs in this step, after which that collection will be used next to the built-in PWM libraries. |
| Step 2: Select which promoters ConTra should use |
|
In the second step ConTra shows a list of genes that (fuzzily) matched the identifier provided in the first step. Some genes code for several transcipts of which eventual context-dependent differential expression could (partially) be explained by the presence or absence of binding sites for the context specific TFs in their promoter regions. Therefore, ConTra groups the transcripts by transcription start site (TSS), resulting in one or more groups of transcripts having the same promoter. The user can select up to 10 different promoters from one or more genes. More information on genes or transcripts is provided by links to either Entrez Gene and Ensembl gene view for gene information or to the UCSC genome browser and Ensembl transcript view for transcript information.
|
|
ConTra uses the promoter region 2000 nt upstream of the TSS by default, but lengths of 500, 1000, or 5000 nt can be specified.
|
| Step 3: Select which alignment to use for promoter analysis |
|
Multiple sequence alignments are: UCSC multiz 17-way, UCSC multiz 28-way, Pecan 12 amniota vertebrates, 9 eutherian mammals and 4 catarrhini primates. The pairwise alignments are blastz-net alignments from UCSC. We experience that in most cases multiz 17-way alignments are best suited for exploration and visualization. |
| Step 4: Select the stringency of TFBS prediction (and PWMs) |
|
ConTra uses position weight matrices (PWMs) from four databases: TransFac, JASPAR core and JASPAR phyloFACTS, and a Protein Binding Microarray (PBM) derived collection of homeodomain TF PWMs (see here and UniProbe).
|
| ConTra results |
|
Visualization part:
The results page shows the user's input followed by the output. The input consists of promoters (indicated by a (group of) transcript(s)), alignment type and PWM prediction stringency. The ouput consists of links to 2 files per promoter that are available for download. One file contains the alignment (.fasta file) and another contains the positions and colors of the binding sites (feature color or .fc file). These files can be opened with Jalview to create output for publishing purposes. First open the alignment file by clicking File > Input alignment > from file and select the file. Next use the "Load Features" command from the "File" menu. Now the predicted binding sites (features) are colored. In the "View" menu the window with the features can be activated by selecting "Feature Settings...". In this window the different binding sites can be selected and deselected by clicking the checkboxes. For more information on the use of Jalview click here. Following these links are the promoter alignments with the predicted TFBSs in a different color per PWM. The TFBSs can be made (in)visible by (un)checking the checkboxes at the left. |
| Example: ATOH7 |
|
The UCSC multiz 17-way alignment of ATOH7 (Ath5) clearly shows the conserved TATA box and two conserved E-box motifs as described by Del Bene et al (PLoS Genetics, 2007). Step 1: Enter "ATOH7" as gene name and click next.Step 2: Select the first transcript NM_145178 (RefSeq) and set 200 bases upstream to use. Click next. Step 3: Use the default UCSC multiz 17-way alignment and click next. Step 4: Select the V$EBOX_Q6_01, V$TATA_C and V$TATA_01 position weight matrices (PWMs) from the alphabetical list of PWMs from Transfac and click "Run Contra". Results: 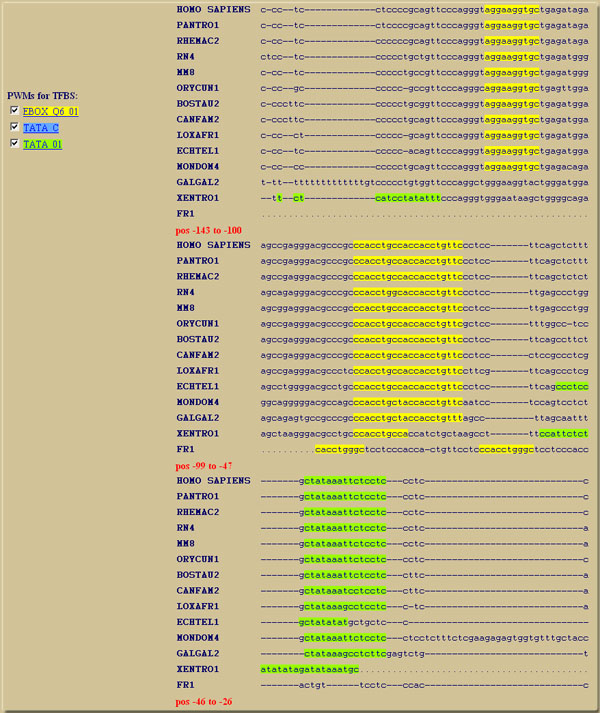
For publication purposes the ConTra output files (.fasta and .fc) can be imported in Jalview for visualization and header editing and can be exported again as EPS / PDF e.g. |
| Validated examples analysed in ConTra | ||||||||||||||||||||||||||||||||
|
| ConTra | contact |
